Uncertainty for classification and regression tasks

The ways of estimating uncertainty for both classification and regression tasks are similar. The uncertainty is considered as Variance (\(\sigma\)) for regression task and Certainty(\(c\)) for classification task, it can be output as independent branch or just an additional channel alongside the other task:

uncertainty_outputs

Once we get this additional output, we can then put it in a mathematical framework and form a loss function to make it learned automatically.

Theoretically, two layer neural network as an universal approximator can fit any random functions. We just need to increase the number of features of the hidden layer to make everything fitted. But the efficiency is very low.

Why deep

According to the paper Topology of deep neural networks, evey layer of a ReLU neural network is try to separate the data points by folding the high dimension manifold. The paper uses the Betti number to measure the distance between the current folded manifold and the final target manifold, it discovered that the works each layers have done are different for different networks.

For shallow networks, most of the folding efforts are done by the last layer. For deep networks, the folding efforts done by each layer are similar. Which means, the works done by each layer of a deep neural networks are relatively simple and easy, but the works to be done by the last layer of a shallow network are complicated and hard.

It is not hard to imagine, the deep neural network solves the problem by abstracting it, which makes the training easier and of higher efficiency.

The deeper, the better?

But it doesn’t mean the deeper is better, the paper Increasing Depth Leads to U-Shaped Test Risk in Over-parameterized Convolutional Networks shows that from the beginning depth really helps the neural network to get better, but once the depth passes a threshold, the network get worse:

depth-accuracy

From the left to the right we can see how the test error changes with the change of depth on ResNets of different widths. Obviously, for whatever width, ResNet18 always achieves the best accuracy, and it gets worse after that.

We can understand it in a straight forward way: if the problem is simple, we should not over-abstract it, the networks will be confused by solving a simple problem with too many abstraction. On the other hand, if the problem is very hard, the network needs more layers of abstraction to solve it properly.

Uncertainty estimation of the output from a deep neural network has recently become a hot topic, mainly due to Alex Kendall’s PhD thesis Geometry and Uncertainty in Deep Learning for Computer Vision, where he mentioned the uncertainty problems for semantic and geometrical problems in the computer vision field. What is more, it provides us a weighting strategy for the losses of multi-task learning, which is a very practical problem in both the academical and industrial fields. It is highly recommended to take a close look at Alex Kendall’s presentation of his PhD thesis Geometry and Uncertainty in Deep Learning. As a short introduction of Bayesian deep learning, you can also take a look at his blog article Bayesian deep learning - Alex Kendall.

Come to the topic today, the paper published in ICCV 2019 Gaussian YOLOv3: An Accurate and Fast Object Detector Using Localization Uncertainty for Autonomous Driving tries to apply uncertainty estimation for the detection task, and it succeeded. Uncertainty estimation is much more than uncertainty output, it can also be used to construct a loss function and raise the detection accuracy. The paper focused on estimating the uncertainty of the bounding box localization, which means the coordinate of the bounding box center and its width and height. By using the uncertainty estimation, the paper managed to achieve 3.5 more mAP than the original YoloV3 with 1% more computational cost, what is more, the implementation is also quite straight forward. This blog will provide a in-depth explaination of this paper.

In graph optimization 1 to 3, the math is introduced. Now we can make some hands on practice on programming. The most famous used graph optimization library is g2o due to its good performance in ORB-SLAM. g2o also has its well known drawback - not well commented, not easy to understand. What’s more, most of the tutorials are based on the original sample examples, when you want to make your own vertex or edge, you will again be lost.

This introduction will be based on an easy to understand graph optimization problem with a customized edge implementation.

Modelling the GPS based odometry

Model as graph

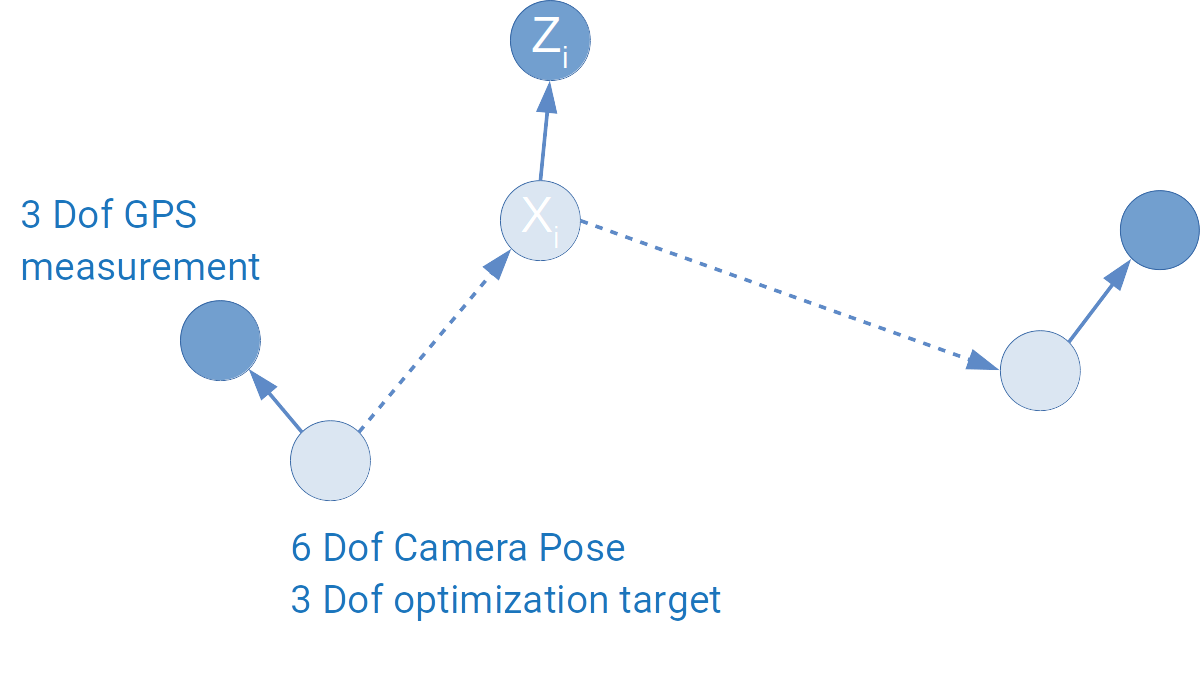
The problem is quite easy: we have a vehicle moving around, we use a GPS to measure its 3D absolute positions, by making some rough guesses as initialization, we want to estimate the vehicle’s position based on the GPS’ measurements.

In a SLAM system, we usually want to fuse different sensors, what’s discussed most are fusing camera and IMU, which is also the problem setup for g2o examples. Fusing GPS information is rarely touched, actually GPS sensor fusion is easier to understand. It can be modeled as the following diagram:

g2o_gps_edge

From the last article, we get the following negative log likelihood function as our optimization target:

\[F(x)=\sum_{ij}{e_{ij}(x)^T\Omega_{ij}e_{ij}(x)}\]

The optimization problem turns to be:

\[x^*=\arg\min_xF(x)\]

This article will explain how can this optimization problem be solved using Gauss-Newton method.

Usually, all graph optimization papers or tutorials start from raising the optimization problem: minimizing the following function:

\[F(x)=\sum_{ij}{e_{ij}(x)^T\Omega_{ij}e_{ij}(x)}\]

This article will explain where this optimization comes from and why it is related to Gaussian noise.

Maximum Likelihood Estimation with Gaussian noise

The probabilistic modeling of graph optimization is based on the Maximum Likelihood Estimation(MLE) algorithm. (More information on Chapter 6 of Xiang Gao’s book.).

The case we use for this article will also be the one we used in the last article:

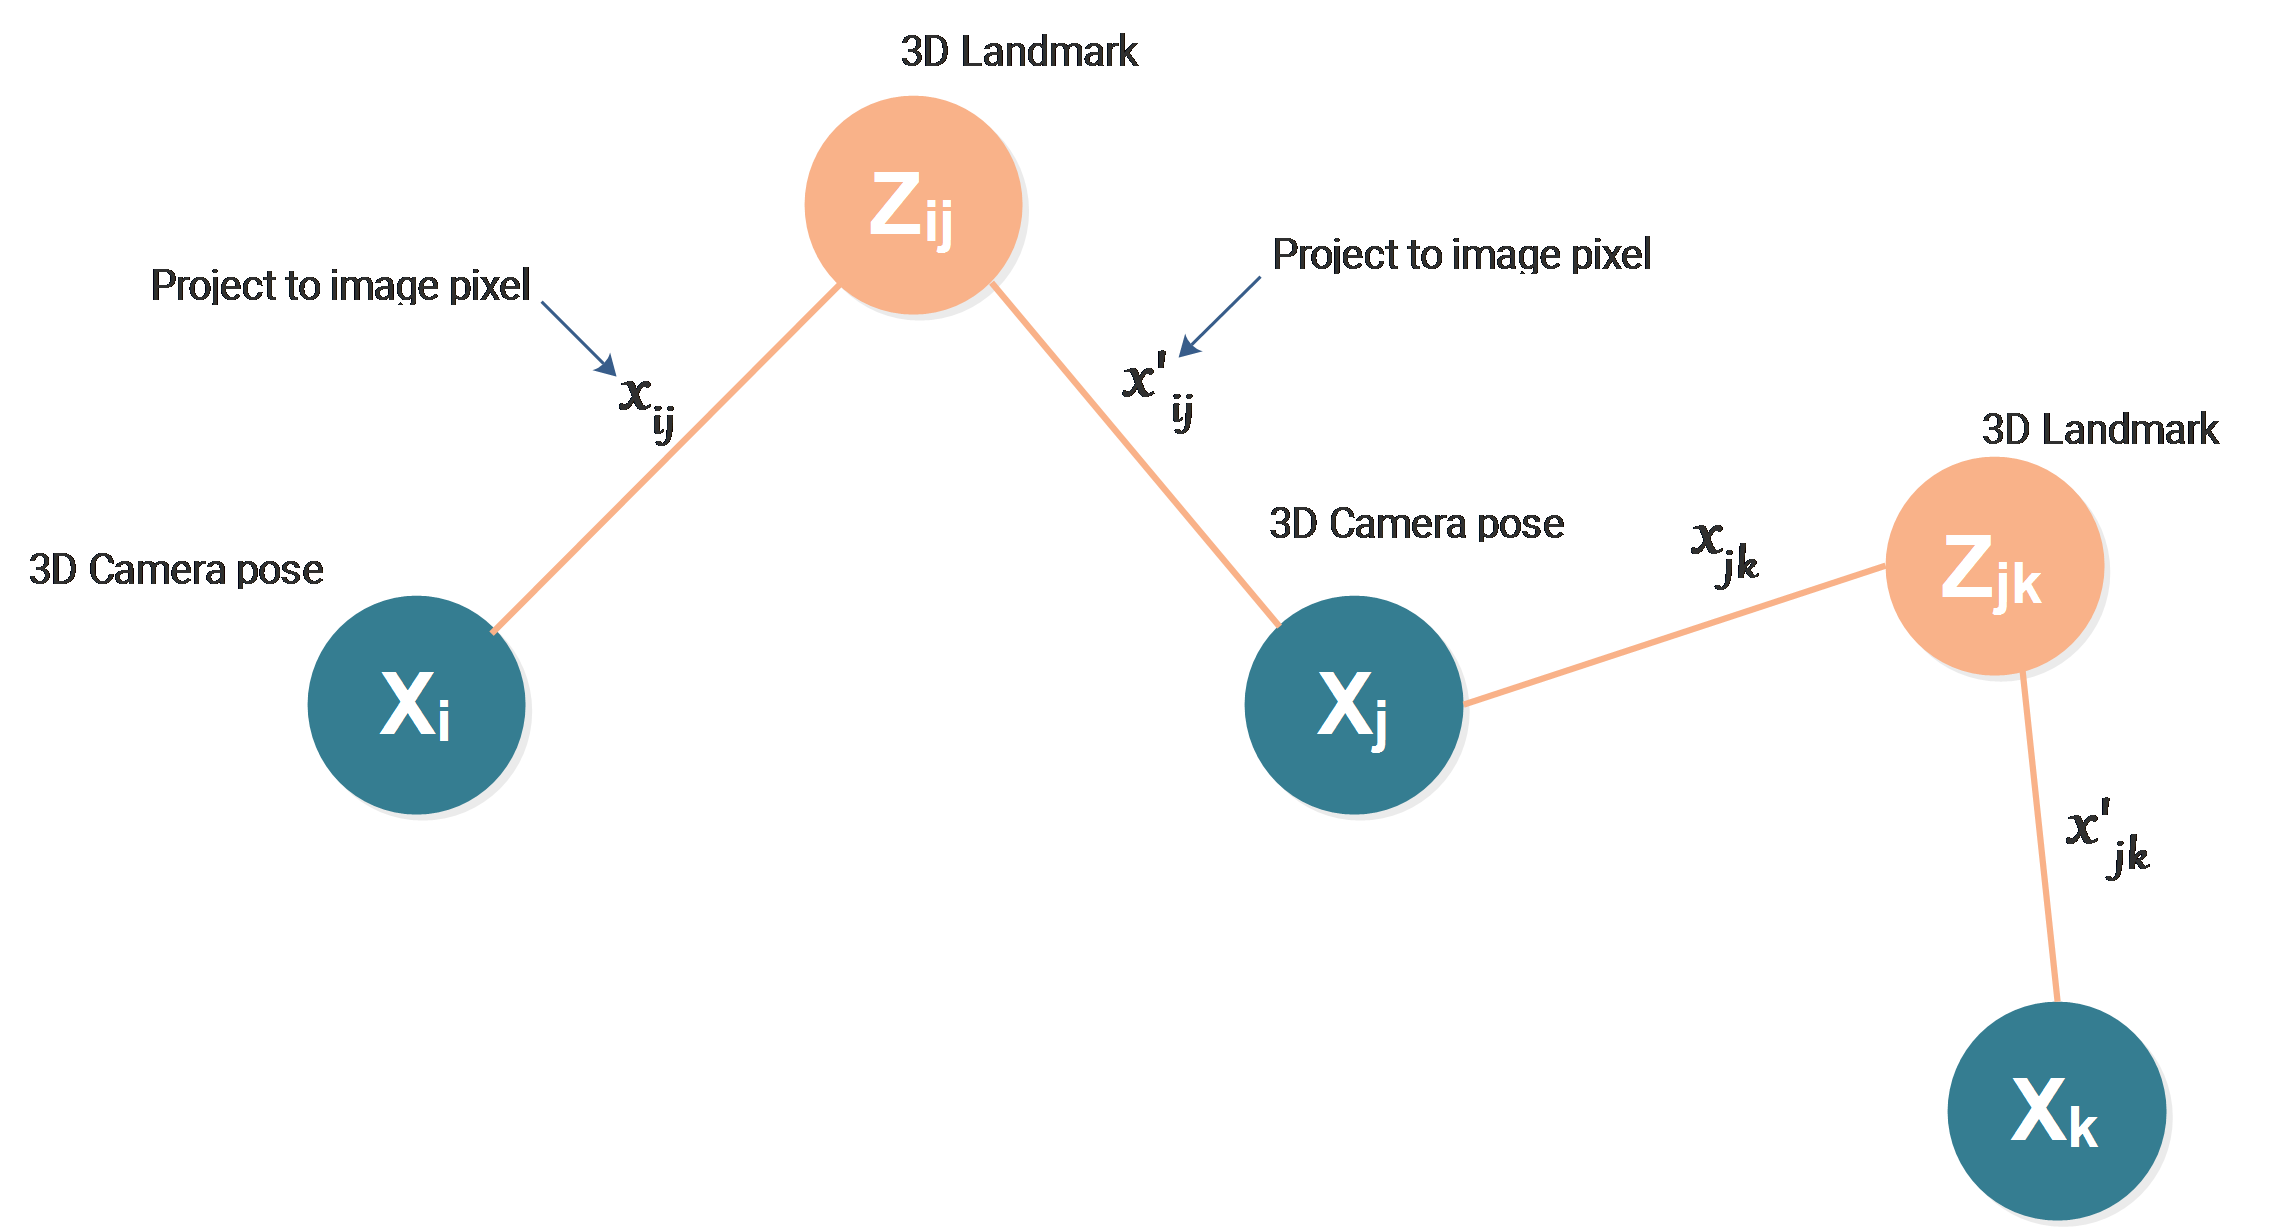
g2o_edge_vertex_noedge

The idea behind PCA

In the field of machine learning, PCA is used to reduce the dimension of features. Usually we collect a lot of feature to feed the machine learning model, we believe that more features provides more information and will lead to better result.

But some of the features doesn’t really bring new information and they are correlated to some other features. PCA is then introduced to remove this correlation by approximating the original data in its subspace, some of the features of the original data may be correlated to each other in its original space, but this correlation doesn’t exit in its subspace approximation.

Visually, let’s assume that our original data points \(x_1...x_m\) have 2 features and they can be visualized in a 2D space: